Hello, all of our layout cells are designed using the copper layer "Cu_1", which is the top layer of copper on the circuit board.
If I want to reuse a layout cell on the bottom ("Cu_4"), do I have to duplicate the layout cell and change the model layer to "Cu_4"?
If there is a "proper" way to do this without duplicating the layout cell, then please let me know because if I have to make a change in a layout cell I would prefer to do it in one place on the top and bottom of the board!
I am trying to understand the difference and correlation between timeaveraging and sampled jitter method.
For sampling jitter, it calculates noise at particular threshold point. And for time averaging it calculates noise with AM and PM, whether the noise varies signal's amplitude or phase.
So I simulate jitter of one inverter, get result of PSD_pm0 and PSD_pm1,which are rising edge and falling edge pm jitter results .
Then I add a limiter(comparator in ahdlLib) at inverter output, simulating its harmonic 1st's USB/LSB noise in dBc/Hz using time averaging, at this moment there is no AM noise.
Further more, I simulate PMOS or NMOS's noise contribution by using analog option, and get result PSD_pmos and PSD_nmos.
I guess PSD_pm0= PSD_pmos and PSD_pm1= PSD_nmos but what I get is PSD_pm0= PSD_pmos+6dB and PSD_pm1= PSD_nmos+6dB
I have been trying to use the portAdapter from the rfExamples lib to sweep my load impedance. I run into issues there. Please check the image below :
Image may be NSFW. Clik here to view.
For gamme=0.6, and phase=90deg, the output log shows that I have neg resistance at the portAdapter. I would like to understand what is going wrong.
Image may be NSFW. Clik here to view.
These are the Properties form of all the instances.
Since I encountered issues with the portAdapter and since portAdapter is really not necessary for HB simulations, I thought I will try the Loadpull option within the HB analysis setup form.
So my schematic looks like the following :
Image may be NSFW. Clik here to view.
In this scenario when I run the simulation and look at the output log, I dnt see any negative resistance issues.
I am very new to Cadence and been trying to set up a quite simple simulation without success. I am trying to simulate an envelope detector (AM demodulator), where I feed a double sideband AM signal and see what is downconverted at the output (baseband). For speed and efficiency I want this to be a large-signal/small-signal hb analysis, so this is what I did so far:
1) Set up a port with a sinusoidal excitation at frequency "frf" (the carrier). I select a certain amplitude, and I also select a "PAC Magnitude" under small-signal parameters
2) I load the variable "frf" in ADE and give it some value, and set up hb analysis where I sweep the carrier "frf" in a certain range. That, as far as I understand, will solve the circuit with harmonic balance for the different values of "frf"
3) I add hbac analysis on top, which I want to use to process the two sidebands treating them as small signals.
The problem comes in the last step. Setting upper or lower sidebands as "frf+fsb" and "frf-fsb" seems to give what I want, and I can plot the output of both hb and hbac analysis for each of the sideband separately. However, I cannot find a way to include both sidebands at the same time. I haver tried with a sweep in the hbac analysis which includes only the two points "frf+fsb" and "frf-fsb" but I cannot make sense of the result, or select the appropriate harmonics.
What am I missing here? Is there a better way to do what I am trying to do?
I have a single receiver circuit which has both a VCO and a mixer (from supply to gnd).
I need to simulate Noise figure of this Receiver. Please let me know the correct simulation setup.
This is what is happening when I'm using hb with hbnoise.
In 1st case, I'm giving two tones in hbnoise, one of which being the oscillation frequency fo, and the other being RF frequency frf, provided the sweep type is absolute. But it isn't considering the second source to be possibly an input source and therefore the NF option is disabled. I'm checking the Output Noise in this case.
In the 2nd case, I'm disabling the frf source and doing a 1 tone hb simulation and checking the Output noise again.
When I simulate a divider as shown in the circuit diagram below, I find that if I don't give the initial state of the circuit shown in the diagram, the circuit doesn't achieve its function("1" for high voltage 1.2V, "0" for gnd 0V). I set the initial condition in ADE simulation>>convergence aids>>initial condition. The problem is that if I set the initial condition, PSS does not converge and if I don't set the initial condition, the PSS converges but the circuit does not work(circuit nodes do not see any level changes). And I find that Conv norm keeps the value of 606e+03 constant. So how do I set it up to make the PSS converge?
I am trying to implement a design flow where I can simulate parts of my circuit with EMX (e.g. an instance of a custom made inductor), and the remaining parts with parasitic extraction. For this I have been following the RAK "Virtuoso RF Solution: IC Layout Electromagnetic Simulation." In particular, modules 3 and 4 of this RAK should contain what I need. I have followed module 3 for one of my designs without problems, in which I select a specific instance in my layout and get it extracted with EMX, and produce an extracted view. The problem comes in module 4 when doing LVS on the circuit. LVS using both Assura and PVS fails, with PVS prompting the following: ERROR (OSSHNL-116): Unable to descend into any of the views defined in the view list, 'auCdl schematic', for the instance ...
The instance I am simulating has no schematic view, but just a layout and custom made symbol. After simulation with EMX, an em_extracted view is added as well. The difference between the example in the RAK and my own circuit is that while the instance from the RAK has no schematic either, it does have "auCdl" and "auLvs" views. After reading about somehow similar issues in the forum, I went on and copied my symbol to both of these views. LVS seems to move forward a little bit further, but still fails and prompts: ERROR (NVN-13010): Cell ... is not defined.
I guess something else has to be defined (something is mentioned in the forum about editing "CDF") but I am not sure what. I am still rather new to Cadence, so I find this all a bit confusing. What I need from LVS here is just to acknowledge that there is layout connectivity to this instance as specified in the schematic, but whatever is on the instance itself is being modeled by the EMX extraction. If anyone can shine some light or give a hint on how to proceed, it would be much appreciated.
The DC Operating Point of a NMOS is shown below. I want to know the parasitic capacitance of the NMOS. But there are cgs, cgsbo, cds and cdsbo. cds equals cdsbo while cgs does not equal to cgsbo. So what is the difference between parasitic capacitance with suffix "bo" and without it. I don't quite understand.
we have quite a noisy osc for app. 65MHz, and we are not sure if pss and pnoise results are 100% correct (like using lorentzian setting or not). So we run a long tran noise simulation, and can e.g. plot period jitter vs time (or cycle). But how to get phase noise from this time domain data? Can I do it within Cadence?
I am investigating a ring oscillator (cmos inverters in chain) for its close-in phase noise. My understanding is that the Lorentian spectrum is supposed to approximate the phase noise PSD at small offset frequency so that it does not go to infinity.
I ran 3 simulations with SpectreRF and plotted the phase noise. The way they are obtained are explained below:
Blue: transient noise simulation: The rising edge time of the clock are obtained and the absolute jitter is obtained by comparing with an ideal clock. PSD of the jitter sequence is obtained in matlab and scaled properly in matlab
Red: PSS/pnoise simulation: Pss/pnoise is performed with sampled(jitter) option on the crossing point of the rising edge. Phase noise is then plotted
Green: PSS/pnoise simulation: Pss/pnoise is performed with timeaverage option. Lorentzian option is turned on. Phase noise is then plotted
Please note that it has been confirmed that the integrated Lorentian spectrum matches the power of the clock fundamental signal power. Also, please note that I have confirmed that timeaverage pnoise has the same result as sampled(jitter), as expected for a sqaure-wave clock.
What I don't understand is why the transient noise simulation result is not flattening as the Lorentian noise spectrum is showing. The transient noise PSD (blue) is matching that of the phase noise plot of the Red. I would think that transient noise should have the large signal effect of the circuits so that the close-in phase noise should be bounded as predicted by Lorentian (green).
Please shine some light if any of you have knowledge on this.
What is the procedure to do loadpull at second harmonic by providing a resistance at first harmonic and short at other harmonics using portAdapter? Is there any other way to do the same?
I am doing some basic analyses on a very simple sampling structure and I am having issues getting the same results with TRAN and HB.
I have tried multiple things I am not going to bother you with, but I'd like to ask about a result I'm particularly puzzled by.
The circuit:
Image may be NSFW. Clik here to view.
(V0 has 1V amplitude)
I obtain what I expect when running TRAN, however I would like to go for more advanced analyses for which a stepping stone would he HB (ideally, HBAC but I couldn't make it work, so I stepped down to a simpler arrangement).
When fRF is offset from fLO by a certain quantity fIF (1MHz in this setup), I thought I'd set HB up with two tones. Since the LO is rapidly switching (it's a square wave), I set it up as the first tone with 15 harmonics, while the input source is just a sine.
Image may be NSFW. Clik here to view.
I am not interested in all possible frequency mixes, so I use an harmonic selection based on funnel, i.e. I keep all harms of LO but consider only low order products around those harmonics:
Image may be NSFW. Clik here to view.
I know from theory what I should get which is, for node vx above, a component at fRF, with a certain amplitude.
The TRAN results comfort me in this expectation, as the time domain waveform looks like this:
Image may be NSFW. Clik here to view.
which is a wave I can apply a DFT to, to reveal its nature of 10GHz wave with a slowly varying envelope on top
Image may be NSFW. Clik here to view.
(note: there might be aliasing effects in this DFT, I have not checked thoroughly that my setup is correct. However, the gist of the properties is there and voltage amplitudes are "reasonable").
On the other hand, the spectrum out of the HB simulation looks dim:
Image may be NSFW. Clik here to view.
I then thought to force HB to show me what it calculates for transient values:
Image may be NSFW. Clik here to view.
and this is where I got the surprise: the input net of the circuit, /net1, the one where V0 is connected, remains at zero during the transient run:
Image may be NSFW. Clik here to view.
Now, I don't know whether this is just an artifact and not the real culprit here, since if one examines the spectrum of /net1, one does see a spectral line at fRF (10GHz + 1MHz),
so maybe this is just "cosmetics", however it makes me think I am missing some fundamental point here for this type of simulations.
Can you guess what is happening and why I am not able to simulate this circuit properly with HB?
Thanks,
Michele
P.S.
Image may be NSFW. Clik here to view.
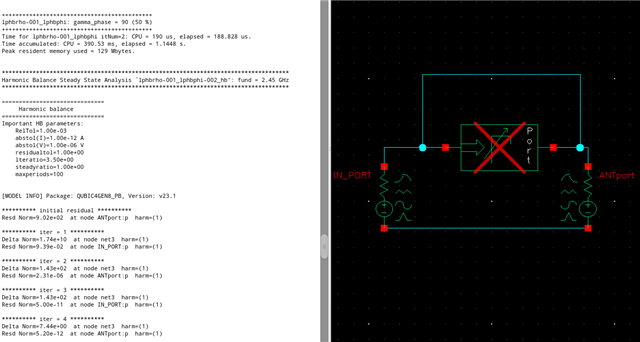
EDIT: I've tried to run QPSS instead of HB:
Image may be NSFW. Clik here to view.
Here the engine is however shooting, so that might make a difference.
Three points to notice:
1) the simulation takes much longer. I hope I am just overdoing something because this circuit is as simple as it gets. I don't want to think what would happen for something any more resembling to a true circuit.
2) the pss-tran waveform for /net1 keeps at ZERO steady :-( - This probably means I am really missing something fundamental.
3) this time the specturm of vx is as I would expect it. Actually, perfect and without aliasing:
I am trying to do a PEX for some varactors that I have in my design, and the post layout simulation results are weirdly inaccurate. I feel like the Quantus tool disregards my varactor instance and calculates the parasitics as if I just had the metal layers I added myself in the layout view.
A simulation of the varactor in schematic view with Spectre shows that my capacitance changes between 190 fF and 450 fF when I change the DC voltage around my varactors, but when I add the dspf file generated by Quantus, my capacitance drops to 1 fF independently of the DC voltage value ! on the Quantus window, I choose transistor dspf as an output type, I don't know if this is the issue but I tried some other types of output and none of them seems to give an answer to my problem. Could someone advise me on what output type I should choose for something like a varactor, which is not a transistor but also technically not a passive element ? I would be grateful.
I am exploring noise simulation capabilities and I stumbled upon something that looks strange to me, namely that when I list the noise contributors for a certain circuit containing ideal inductors and noiseless ports (set specifically to that status), I still see noise coming from resistors associated with those components. I am wondering what is it that I am doing wrong here.
This is the Results Window:
Image may be NSFW. Clik here to view.
So, given for instance that I did not specify any kind of external files for the ports, nor any resistance for the inductor primitives, and explicitly set "isnoisy=no" to the output port (P2), why am I seeing noise from what is, in my understanding, ghost components?
I have OCR'd the netlist to tray and avoid last pitfall, just in case we want to have a base:
dcOp dc write="spectre.dc" save=all maxiters=150 maxsteps=10000 \ annotate=status dcOpInfo info what=oppoint where=rawfile noise noise start=50G stop=90G oprobe=P2 iprobe=P1 separatenoise=yes \ annotate=status sp sp ports=[P1 P2] start=50G stop=90G donoise=yes oprobe=P2 iprobe=P1 \ annotate=status modelParameter info what=models where=rawfile element info what=inst where=rawfile outputParameter info what=output where=rawfile designParamVals info what=parameters where=rawfile primitives info what=primitives where=rawfile subckts info what=subckts where=rawfile save D_choke:1 saveOptions options save=allpub
--------------------------------------- END OF NETLIST -----------------------------------
NOTES: there are some extra simulations as I'm actually trying to build a bridge between SP and AC noise as far as NF is concerned.
This works well for those specific outputs (NF is consistent if you specify P2 as a "port" for the load), but somehow (and this is what I was trying to achieve in the first place), the standard AC noise output always includes all noise, no possibility to take the "load" noise out of the equation in an easy fashion. That's why I was looking at the contributors to try and isolate the load induced noise and have a confirmation of the NF result through another way. That's when I found that other components were unintendedly making noise.
There is another thing I would like to understand about how the simulator works in this instance, but I'll keep it separated from the "buggy behaviour" I just wrote about.
From the Manuals, this is the relationship between NF calculation and other AC noise outputs:
Image may be NSFW. Clik here to view.
(a little unfortunate typesetting here)
So the NF or its linear cousin F, rightfully, do not include the noise due to the load of the DUT, just that of the DUT itself and of the input source.
On the other hand, AC noise calculates the total noise at the output. Moreover, it does not give access to the NI component in the manual's screenshot, i.e. the output noise due to the load.
Since I absolutely want to be able to calculate "NF-like" quantities, but not always having voltage at the output, and I don't want to always depend on the NF calculation, I set out to find an "alternative" way to double-check the NF results.
To this end, I just then thought, in the first instance, to load my DUT with a noiseless resistor, so that the NI part above is automatically zero.
Image may be NSFW. Clik here to view.
Given that I don't use the "noise separation" option, the noise summary shows (more or less) what I would expect: no trace of Rl:
Image may be NSFW. Clik here to view.
Now, I have to say that "ext_file_noise" contributor still bothers me, but at least there's no other contributor beyond the input port and the transistor itself.
According to my understanding I should be able now to plot NF and to superimpose a curve to it, by just calculating textbook-like:
output_noise/(input_noise*gain²)
Because - following the manual - the gain is voltage and referred to the internal source of the port:
Image may be NSFW. Clik here to view.
then the input noise of the source is simply 4*K*T*R (in voltage²) and the gain is just the gain coming out of the noise simulation.
However, when I do all this, I get a curve with a constant difference, and I don't know where this difference is coming from:
Image may be NSFW. Clik here to view.
This difference is constant.
These are the definitions used for my version of NF:
In a microelectronics (packaged RFIC or SoC) context, what dielectric model would you advise or recommend to use in Clarity 3D? All dielectric materials are of Dispersive type (Piecewise Linear when Causality is not enforced; D-Sarkar and Debye when causality is enforced). Do you have public examples comparing measurement to simulation results?
What about a silicon bulk substrate when there is non null conductivity? D-Sarkar not applicable.
I would prefer to use constant dielectric characteristics over my frequency range (not extending higher than 60 GHz). Do you have any comment?
Hi, I am trying to obtain frequency-swept Gain and Group Delay plots through a frequency converter modeled in VSS. I have set up a VNA block with the FSTART, FSTOP, FSTEP specified as input (stimulus) signal frequencies, but am having trouble setting up the "S21_PS" & "GD_TD" measurements such that the frequency conversion is taken into account. I have the Frequency sweep variable set to "Use for x-axis" but am not seeing anything on the graph, and am confused as how to specify the output (response) frequency in general.
Hi, I have an AMP_B block that I'm driving into saturation, and I'm noticing around a 4 dB difference in compressed stage output power depending on if I use the Time Domain Simulator (measured with PWR_MTR, verified with PWR_SPEC), or the RF Budget Analysis (measured with SPWR_node). A side-by-side comparison is shown below, where I am sweeping the input power. The left plot shows the input and output power of the compressed stage, the right plot shows the entire chain cascaded signal power. The AMP_B block is set up with OP1dB = 19 dBm / Psat = 21 dBm, so the RF Budget analysis seems to be the more realistic of the two.
Image may be NSFW. Clik here to view.
Is there something I am missing in my interpretation? Or is AMP_B not suitable for large-signal analysis with the Time Domain simulator?