Quantcast
Channel: Cadence RF Design Forum
Viewing all 956 articles
Browse latest View live

Where can I find the translator to convert TSMC IRCX files?


BER vs BER approx

$
0
0

Hello there,

I am simulating a high speed amplifier design and to evaluate the system performance I plot the so-called "bathtub curve". I have to questions regarding my current simulation:

1.) How does ViVA-XL calculate the BER approx and how reliable is it? I have read the user guide (November 2023) and cannot seem to find documentation or mention of it. I cannot find it also if I scour the internet / Cadence forums.

2.) My target is to have a BER smaller than 10e-12. My simulations so far (without the BER approx) yield only until 10e-8. How do you setup a simulation to reach as low as 10e-12? Is it just a longer simulation time (i.e. more data)?

3.) In my specific simulation the BER approx (left) is only a single point. I was expecting a number of points to form the "bathtub curve". What could be wrong with my simulation or way of calculating BER?

Thank you,

Al

Files extensions

$
0
0

Hi,

Sorry if my post isn't in the right section.

I took over a project from a closed company and I have some files and I don't know how to open them.

I have four .art and one .drl.

Can you help me?

Regards.

Anthony

Power supply

$
0
0


Hello,
I have designed an impedance matching circuit to adapt an antenna.

I would like to test the entire schematic by inputting different powers through the input port, such as -10dBm or -20dBm, and seeing the S11, S12, etc. through a graph.
How can I do this?

Thank you very much for your attention!

Regards!

Article unavailable to view

DC Bias point of Spice model in EM Extract (AWR MWO)

$
0
0

Dear all, 

I have a simulation of an amplifier circuit (PCB) that consists of some lumped parameters and a nonlinear device. 

As soon as the EM Extract block is enabled the DC bias (DCVS block) voltage does not apply any current and thus the transistor model (SPICE) does not work. 

How can I fix this problem? (For now I include DC into my simulation) 

Second problem but not as important as the first one is that as soon as I hit run the EM Model gets overwritten and therefore I cannot change things before simulation. 

What I want is to set the ports to connect to lower and draw a GND plane beneath the circuit because I have 4L substrate.

Plot on Smith Chart from HB Simulation

$
0
0

Dear All,

To design an outphasing combiner, I need to extract the input impedances when the circuit is driven by two sources concurrently with a varying phase-shift and plot them on a Smith Chart. However, I can't find a way to display the simulated S-parameters on a Smith Chart.

The testbench, shown below, consists of two sources set to 50 Ohm with variable phase (PORT0: theta, PORT1: -theta) swept from -90° to 90°. The NPORTs are couplers used to isolate the forward and reflected power at each source, i.e. the S-parameters are:

  • S13 = S31 = 1; through path
  • S21 = S41 = 1; forward and reflected power
  • All other are zero

Combiner testbench

The testbench is simulated with an "hb" analysis instead of "sp", as the two sources have to be excited simultaneously with varying phase-shift to see their load-modulation effect. The sweep is setup in the "Choosing Analysis" window. The powers of the forward (pXa) and reflected (pXb) waves are found through the "Direct Plot" window, e.g. pvr('hb "/p1a" 0 50.0 '(1)) as the power for p1a, and named P1A_Watt. The S-parameters are then calculated as the reflected power w.r.t. the forward power P1B_Watt/P1A_Watt. This approach is based on a Hot S-parameter testbench from ADS.

At this point I would like to display these S-parameters on a Smith Chart. However, this seemed more challenging than expected. One straightforward method would seem to create an empty Smith Chart window in the Display Window and dragging the S-parameters from the rectangular plot on it, but this just deletes them from the Display Window. Hence my question:

How can I display these S-parameters on a Smith Chart?

EMX - Localized back etching

$
0
0

Do you know if it is possible to define localized back etching (LBE) in EMX? It should be associated to a layer which defines the holes done in the substrate. I've not found any reference for this in the .proc syntax. 


EMX - 3D view + 3D view unavailable

$
0
0

Hi! I'm using EMX with 2 design kits. In one works fine. With another, I do not see the mesh or current view. The menu item is not shown. This happens only with one DK. With the other one I'm able to run Paraview without any issue. 


Besides, I would like to know if there is any way to see the 3D view without mesh and current. Just a nice 3D view. 

I've also tried to install the latest version (EMX2023_2) but nothing changes. 

Error with launching Python Script Via AWRDE VBA Script

$
0
0

Hello Team,
I am currently following this AWR script posted on them, to run a python script directly from inside AWR using VBA script.

Launching Python from AWRDE VBA Script - AWR Scripts - AWR Knowledgebase

Following all the basic steps with no changes to the code. I have Vscode and python-3.12.2 installed in my system. 

This is the error I am getting while running this code. 


Thank you for your help 

Best Regards

SID

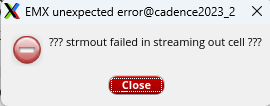
Strmount failed in streaming out cell

$
0
0

Hi, I would be grateful if you can help me with this error which I get after trying to run an EMX simulation on a PCELL.

I've found very limited information in this forum. Thanks

CPW ports

$
0
0

Hi, in EMX I'm trying to define the ports of a CPW line as suggested in one document of the support area (i.e. P1:Gright,Gleft). The EMX simulation works fine. When I generate the schematic, I get this:

Basically, the two ground ports of each end of the CPW are properly defined as a unique node (e.g. G2_1, G2_2). 

However, when I try a simulation I get this error: 


I hope you can help me. Thanks.

Harmonic Balance (HB) Large-Signal S-Parameter (LSSP) simulation

$
0
0

Dear all,

Hi!

I'm trying to do a Harmonic Balance (HB) Large-Signal S-Parameter (LSSP) simulation to figure out the input impedance of a nonlinear circuit.

Through this simulation, what I want to know is the large-signal S11 only (not S12, S21 and S22).

So, I have simulated with only single port (PORT0) at input, but LSSP simulation is terminated and output log shows following text.

" Analysis `hb' was terminated prematurely due to an error "

The LSSP simulation does not proceed without second port.

Should I use floating second port (which is not necessary for my circuit) to succeed the LSSP simulation?

Does the LSSP simulation really need two ports?

Below figure is my HB LSSP simulation setup.

Additionally, Periodic S-Parameter (PSP) simulation using HB is succeeded with only single port.

What is the difference between PSP and LSSP simulations?

Parallel Optimization in AWR MWO - Unable to connect to data source

$
0
0

Hi,

when trying to performe an optimization using parallel jobs (Num of Parallel Jobs > 4) the solver is unable to connect to data source. An Optimization with only one jobs is running without any problems.

Do you have any ideas? Thank you in advance.

Best regards,

Stefan

using steppreset as part of dynamic parameter vector

$
0
0

I can successfully use stepparam as a dynamic variable on its own, but when i try to insert it as part of a setof variables, i get a simulation error

ERROR: Unknown parameter `lx' has been specified in expression `lx'
ERROR: Unknown parameter `cx' has been specified in expression `cx'


Error when trying to generate SUL license (-8)

$
0
0

Hi, newbie here.

We are using AWR Design Enviroment in our university and so I have to install it (OS: Arch Linux)
I installed it in a Windows 10 VM without problems.

When I try to start it prompts "Failed to connect to license server", I guess thats the first problem.

After that when trying to generate my SUL License it will prompt Internal Error -8 (see Image)

I can't find something on Error -8 :/ and overall the available data to the license topic is quit low :/

If someone has a solution for that I would gladly hear about it :)

VAR("") does not work within some expressions

$
0
0

Hi,

My Virtuoso and Spectre Version: ICADVM20.1-64b.NYISR30.2

I have an expression where the EvalType is "sweeps". Here is the expression (I also attached the snapshot):

(peakToPeak(leafValue(swapSweep(delay(?wf1 clip((VT("/clk0") - VT("/clk180")) (VAR("mt_stop") - (4.0 / VAR("datarate"))) VAR("mt_stop")) ?value1 0 ?edge1 "rising" ?nth1 1 ?td1 0 ?tol1 nil ?wf2 clip((VT("/tx_padp") - VT("/tx_padn")) (VAR("mt_stop") - (4.0 / VAR("datarate"))) VAR("mt_stop")) ?value2 0 ?edge2 "rising" ?nth2 1 ?tol2 nil ?td2 nil ?stop nil ?multiple nil) "VDD_FIXED_NOISE") "VREGLN_cmode" 0.85 "VREGDRV_novn" 0.4 "datarate" 1.658e+10) ?overall t) / 10.0)

What this expression does is that it compares the delay between the output data with respect to a reference clock. I then get this information for two conditions (VDD_FIXED_NOISE = 0 or 10mV) to get the effect of the supply-induced jitter. In the expression, I need to give the value of each parameter in different modes to distinguish them from each other. Now I want to sweep the base supply values and see the supply variation effects. For example, I want to change VREGLN_cmode from 0.85 to 0.81 and see how my supply-induced jitter changes. For that, the hard way is to copy the expression and change that value accordingly (e.g. "VREGLN_cmode" 0.81). I'm looking for an easier way to use a variable in the expression. Something like VAR("VREGLN_Sweep"). But I see it doesn't work in my expression and it gives an eVal error. I tested this before in other expressions (not sweep type) and it always worked. I have only one test and these variables are all Design Variables and not Global variables.
I want to know what mistake am I doing here and is there a way to make this work. Sorry that if I could not explain better my inquiry. Thank you.


Crystal Oscillators

$
0
0

Hello, Currently i am designing a 96MHZ crystal oscillator using pierce topology and also I use for amplitude gain control circuit for regulation. The problem is when i run a PSS + Pnoise i get these warnings :

WARNING (CMI-2375): M2: Vgs has exceeded the oxide breakdown voltage of `vbox' = 6 V.
WARNING (CMI-2375): M4: Vgs has exceeded the oxide breakdown voltage of `vbox' = 6 V.
WARNING (CMI-2377): M4: Vgd has exceeded the oxide breakdown voltage of `vbox' = 6 V.
WARNING (CMI-2377): M3: Vgd has exceeded the oxide breakdown voltage of `vbox' = 6.6 V.

and also WARNING (CMI-2682): M5: The bulk-drain junction forward bias voltage (1.38154 V) exceeds VjdmFwd'=851.514mV ,The results are now incorrect because the junction current model has been linearized

Note : i am using Supply 1.2 V hence it is not possible to exceed the oxide breakdown. 

So i am asking why i am getting these warnings , it could be a convergence problem and the Results computed are not corrected.

Also when running DC and transient , i don't get these warnings.

Error in cds_srr (line 20)

$
0
0

Hi, 
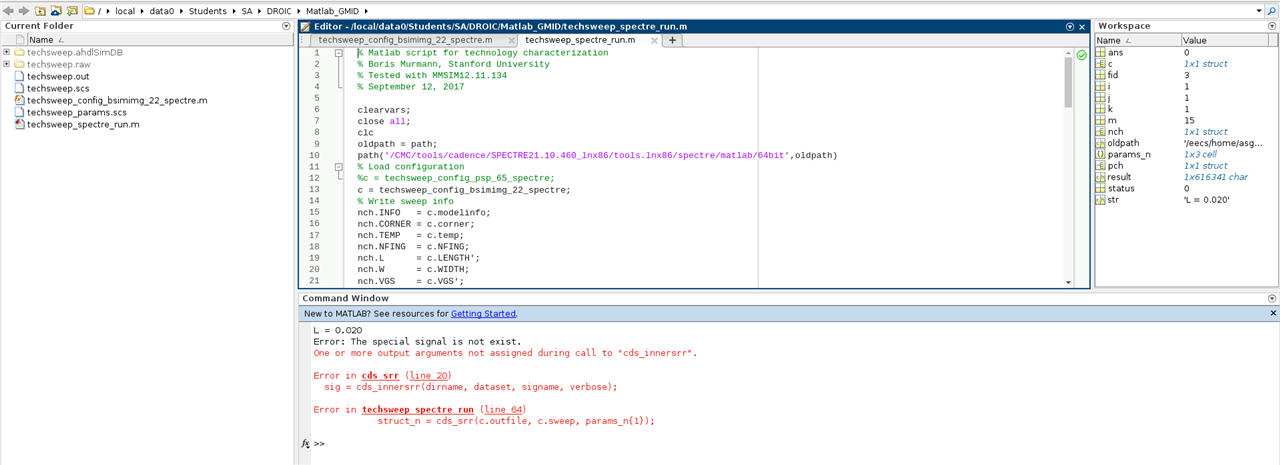
In the MATLAB, I am using cds_srr and cds_innersrr commands. Although I set the path to the spectre root, I face this error:

One or more output arguments not assigned during call to "cds_innersrr".

Error in cds_srr (line 20)
sig = cds_innersrr(dirname, dataset, signame, verbose);

Error in techsweep_spectre_run (line 64)
struct_n = cds_srr(c.outfile, c.sweep, params_n{1});

I would highly appreciate it if you could help me.

Measuring DDJ (data dependent jitter). Cross function on eye-diagram

$
0
0

Hi,
My Virtuoso and Spectre Version: ICADVM20.1-64b.NYISR30.2
I plot an eye diagram using a built in function. I want to see the data-dependent jitter. I want to measure the eye diagram edges at zero crossing (width of that diamond part) shown in the pic by vertical and horizontal markers. I can put a marker and read the numbers there and get what I want. But now I want to run Monte Carlo and I can't do this for all samples. I wish I could write an expression for this. Unfortunately, I see that the function "cross" is not working on the eye diagram. Basically, when I send the eye diagram data to a table, I see that it actually is just the prbs data and not the eye diagram data. Is there a hack that can help me achieve my goal which is: having an expression to measure the edges of the eye diagram at zero crossing?
There is a script that Andrew wrote (https://support.cadence.com/wps/mypoc/cos?uri=deeplinkmin%3AViewSolution%3BsolutionNumber%3D11395772). This is a good script but it puts all edges on top of each other. I want to distinguish the two edges. In the attached pic (two-period eye diagram) you can see the two edges (diamond shapes). I want to measure each of the two and take the maximum. Having all the edges on top of each other won't give me what I want. I also have very little experience with writing scripts and could not modify it myself.
Your help is much appreciated. Thank you.

Viewing all 956 articles
Browse latest View live